
 Arne Maercker — Business Intelligence & Development
1. High energy costs, but no consumption data to base evaluations on
Your company is facing challenges due to high energy costs? Energy is to be saved more than ever, but a solid data basis and meaningful analyses of consumption are not available?
We were also faced with this problem. To identify effective measures, at the end of last year, we wanted to identify periods and business areas with particularly high energy consumption. In this context, we are particularly interested in the consumption on our different floors and asked ourselves the following questions, among others:
- What is the energy consumption (kWh) (per day, week, month) at grandcentrix and how does it develop over time?
- What is the current power (W) on the different floors?
- What is the energy consumption (kWh) during the main working hours (9h-18h), how high between 18h and 9h?
- Are there differences between the different floors?
Based on this, anomalies as well as measures for reduction should be discussed, implemented and subsequently evaluated. The issue here is that until recently, there was no solid data available on energy consumption at our sites. Although all our sites are already equipped with electric meters, a direct transmission and evaluation of this data was not possible.
To solve this problem, we connected the electronic electricity meters in the distribution cabinets of the various grandcentrix sites with Modbus Cloud Connect. Via a BI dashboard, we can now view the current consumption of the different sites and floors at any time and derive measures for energy reduction from this. The result speaks for itself: With this solution, we were capable of identifying significant differences in the electricity consumption of the different floors within a very short time. With measures now introduced to reduce consumption on certain floors, we expect savings of up to **15%.
2. Transferring meter data to the cloud via Modbus interface
Modbus Cloud Connect enables the transfer of device data to the cloud. Our “all-round carefree package” includes all the necessary components for transferring meter data to the cloud quickly and easily:
- A hardware module, which connects to the device via an RS485 interface and can thus capture data from many classic electronic electricity meters.
- A self-service portal, which allows quick configuration of the devices.
- A Cloud adapter (MQTT, HTTP), through which connection to common cloud systems is possible.
- Transmission of data via NB-IoT or LTE-M with availability and excellent network coverage in already over 25 countries worldwide.
At grandcentrix, we connected the electronic electricity meters on our different floors to the hardware module and configured the devices in the self-service portal. Via the NB-IoT mobile radio standard, data on electrical power is now sent 1 time per minute and every 5 minutes the current meter readings, among other things, are initially sent to the Modbus Cloud Connect environment. Here, however, the data is not stored, but can be made available to other systems via the Modbus Cloud Connect Adapter (MQTT / HTTP) for further analysis and visualization. In our case, we opted for a data pipeline in Microsoft Azure as well as displaying the data in Power BI.
3. Installation of Modbus Cloud Connect in three steps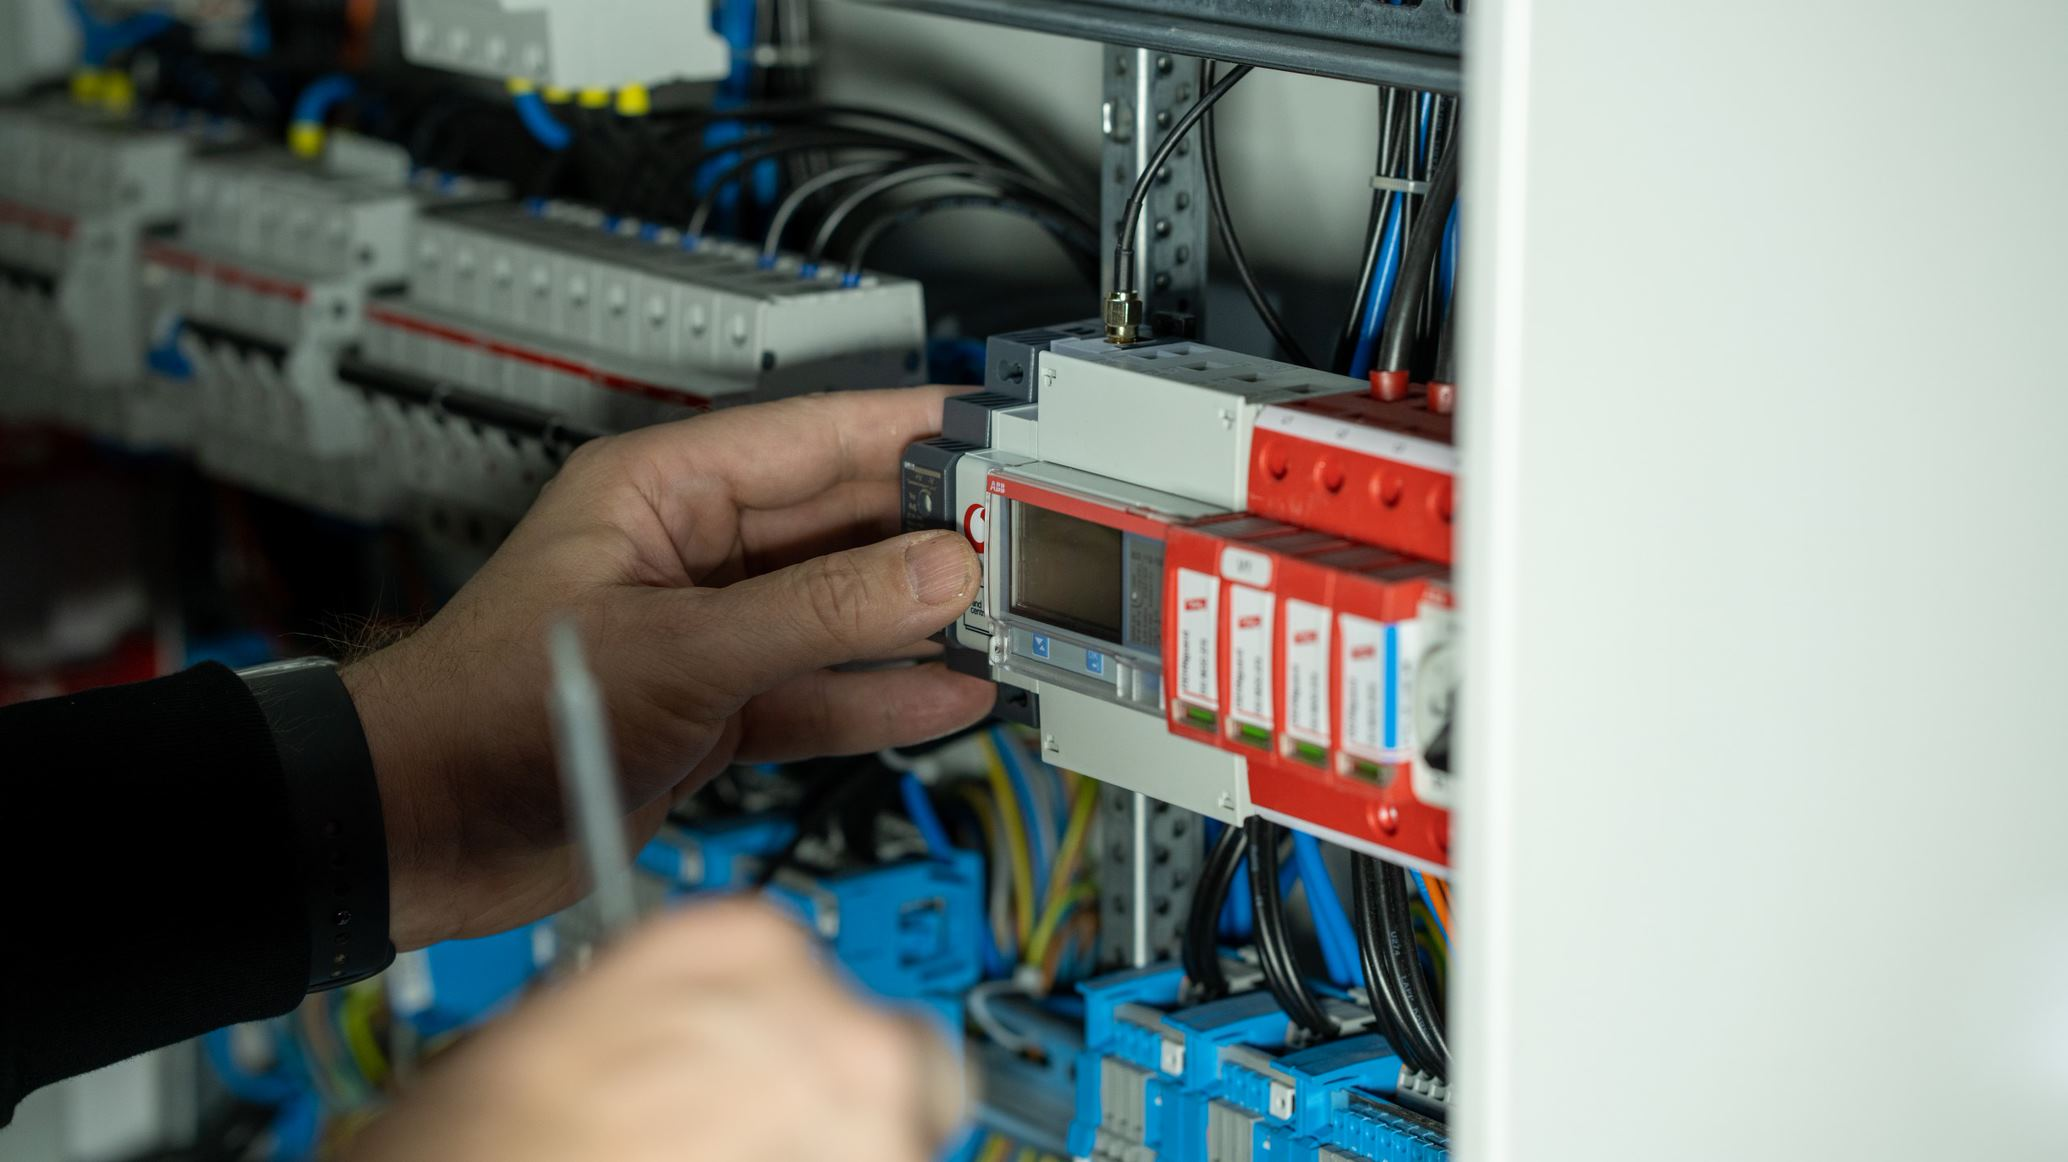
Note: The installation may only be carried out by qualified personnel.
3.1 Wiring the Modbus module to the electricity meter and installing it in a top-hat rail
In the first step, the Modbus module is installed in the meter cabinet next to the electronic electricity meter in a top-hat rail. In addition, the devices are wired together via an RS485 interface. A prerequisite for the use of Modbus Cloud Connect is that a device to be read out with an RS485 / Modbus RTU interface is used.
3.2 Configuring the device in the self-service portal
After the device is installed in the meter cabinet, it is configured via the self-service portal.
1. Activation of the hardware module via QR code
By scanning a QR code on the device, the assignment between device and user account is made. Apart from entering the device name, no other data needs to be entered manually.
2. Configuration of device types
In this step, the various Modbus registers, which are to be read by the Modbus Cloud Connect module, are created and configured for each device type. Here, in addition to the name and data type, the Send interval per Modbus register is also defined, for example. This defines how often the data of the corresponding register is transmitted. Transmission intervals can be set between 5 minutes and once a day. It is also possible to define an alarm register which sends data when a defined alarm threshold is reached.
3. Configuration of the system type
After the device types are created, the configuration of the system type is done. In this step all necessary specifications like baudrate, parity and stop bits for the different used system types are created. In addition, the corresponding device types and bus addresses are stored here.
4. Configuration of the system
In the last step, it is specified which Modbus Cloud Connect module is installed in which devices. For this purpose, the Modbus Cloud Connect modules previously activated by scanning the QR code are “married” to the system type. An exact assignment of the individual values, which takes place via the different Modbus registers in the different system types, is thus made possible.
3.3 Forward, process and visualize data via cloud adapter
Modbus Cloud Connect does not store any data and only passes it on. For further processing and visualization of the data, it can be forwarded via a MQTT / HTTP interface.
For this, various options are possible. We have decided to transfer the data to an Azure Cloud environment. We use the Azure Event Hub as streaming technology, the storage and further processing of the data takes place in Azure Data Explorer and the subsequent visualization in Power BI. Solutions with services from other cloud providers are also possible here. For companies that do not yet have their own cloud infrastructure, it is also possible to display the data via IoT platforms from our partners Datacake or Device Insight.
Configuring the HTTP interface
The HTTP interface can be configured in the self-service portal. Here the placeholders , , must be completed with the appropriate values.
Integration with Azure Cloud Services and Visualization in Power BI
To enable visualization of electricity meter data in Power BI, there are several ways to map the data flow. We have chosen the following solution, which is as simple and quick to implement as possible.
1. connection Azure Event Hub via HTTP interface
2. connection Azure Data Explorer to Azure Event Hub.
3. visualization in Power BI
Azure Event Hub: Azure Event Hub provides an easy way to read external data sources. For authentication, we used SAS tokens in our case. A detailed description can be found here, Generate SAS token. However, authentication via Azure AD is also conceivable.
Azure Data Explorer: Azure Data Explorer provides a convenient way to retrieve and store data from Azure Event Hub in real time. KQL queries can be used to create tables, which in turn can be passed to PowerBI via direct query imports.
Power BI: The tables created in Azure Data Explorer can now be further used in PowerBI. In our case, we built a dashboard that shows the current power (W) on each floor as well as the total energy consumption (kWh) across all floors as well as per floor.
Even with this basic dashboard, we can now identify initial inefficiencies and opportunities for cost savings. For example, it is noticeable that not only during the week, but also on weekends, the average energy consumption on the 3rd floor of our company building is about 50% higher than on the 1st and 4th floors and even about 200% higher than on the 5th floor. According to our current estimates, this is mainly due to test setups from our projects that have not yet been shut down on weekends. Possible measures to reduce this are currently being evaluated.